Comptroller Stringer (photo: @scottmstringer)
The New York City operating budget is an $83.4 billion behemoth, with all the complexity you would expect in a spending plan for a city of 8.5 million residents and many millions more in tourists. Despite their importance, the city budget and other municipal financial documents are not easy to understand or use. But, there have been a series of recent efforts by elected officials to make the city’s finances more open and navigable.
In that vein, Comptroller Scott Stringer, the city’s chief financial officer, created the Popular Annual Financial Report, which was released for the first time last year. On Friday, Stringer is releasing the second annual report meant “to present the City’s financial affairs in a more concise, straight-forward and simplified manner.”
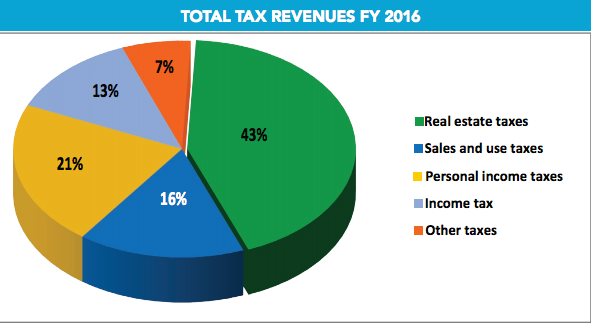
This PAFR covers the city’s 2016 fiscal year, which ended June 30, and breaks down for the public the city’s revenues, expenses, budget, and capital projects. It is about 25 pages of colorful graphs and charts, along with plain-language explanations.
It has sections for the city’s economic forecast and a look at tax revenue growth. It details “Revenues: where does the money come from?” and “Expenses: where does the money go?” followed by other sections, many of which include pie charts and bar graphs.

It is “a user-friendly companion” to the city’s other financial documents, according to Stringer’s statement introducing the PAFR. It complements the city’s Comprehensive Annual Financial Report, which, as its name suggests, is a more lengthy and complex document.
The popular report is “designed to present the City’s financial affairs in a more concise, straight-forward and simplified manner,” Stringer says, and it stands alongside “other important transparency tools, including our interactive CheckbookNYC website” to give “New Yorkers unprecedented access into the inner workings of our government.”
The comptroller’s PAFR tells the user, for example, that in the most recent fiscal year, 2016, “expenses for governmental activities (including all related personnel and applicable pension and benefit costs) increased by over $14 billion from FY 2015 to $86.2 billion. These expenses increased significantly due to higher pension expenses, which was a result of changes in actuarial assumptions related to mortality tables. Additionally, collective bargaining increases resulted in higher expenses overall.”
This statement is followed by a graph and a chart showing expenses in detail.

Above another detailed graph, the PAFR tells the user, “Although 25 agencies engage in some form of capital spending, the City’s capital budget is largely concentrated among 13 budget agencies. Collectively these agencies accounted for approximately 94 percent of all FY 2016 capital commitments.”
Capital spending is for building physical infrastructure. As the PAFR graph clearly shows, the top capital spenders among those agencies are the Department of Education, Department of Environmental Protection, and Department of Transportation.
The PAFR also includes snapshot comparisons of New York City to other cities, including Chicago and Philadelphia, on metrics like tourism. And, it includes a face-book of sorts of top city elected officials.
“My aim is to provide citizens, businesses, and community groups with topline figures on revenues and expenses, as well as a snapshot of our City’s local economy,” Stringer’s introductory PAFR statement says. The first PAFR, last year’s, won the Government Finance Officers Association’s Award for Outstanding Achievement in Popular Annual Financial Reporting.
That first PAFR is not easily findable at the comptroller’s website, which is home to dozens of reports, as one might expect of the city’s chief financial officer. Asked how Stringer can encourage more New Yorkers to engage with the easy-to-use resource he is providing, a spokesperson for the comptroller said, “When we’re transparent, and we work hard at being transparent, New Yorkers benefit. Now more than ever, people need to be engaged at the local, state, and national level. It’s our hope that we can deliver the kinds of tools that help New Yorkers better understand their government.”
***
by Ben Max, Gotham Gazette
@tweetBenMax @GothamGazette


