Though it is common to call New York City a Democratic town, Democrats are actually in the minority. In election after election, the solid majority is made up of non-voters.
That is how roughly only 15 percent of all New Yorkers eligible to vote made Michael Bloomberg the mayor in 2001. In the last presidential election, in 2000, fewer than half of New Yorkers eligible to vote bothered to do so - and that is the highest it ever gets.
So who are these non-voters?
First of course are those who are not eligible to vote. Of the six million New Yorkers who are 18 years of age and older, only about 4.7 million are citizens. Breaking that down ethnically, there were:
• 12 percent of non-Hispanic whites not eligible to vote
• 20 percent of non-Hispanic blacks not eligible to vote
• 34 percent of Hispanics not eligible to vote
• 54 percent of Asian not eligible to vote
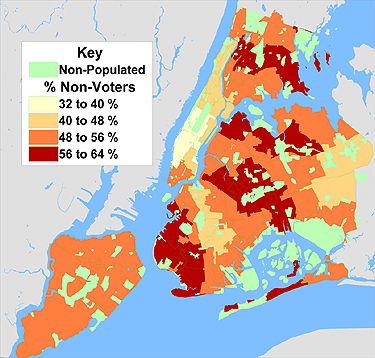
As the accompanying map shows, the areas with the smallest proportion of non-voters are in Manhattan, including the Upper East Side, the upper west side and areas south of 59th Street.

The highest proportion of non-voters live in
- Bensonhurst, Borough Park, and Bay Ridge in Brooklyn
- East Tremont and Bronxdale in the Bronx
- Astoria, Flushing and East Elmhurst in Queens, along with Middle Village, Howard Beach, and Ozone Park.
In short, there is no direct relationship between economic distress of an area and non-voting among those eligible.
Every two years after every national election, the United States Census Bureau asksa representative sample of the US population if they voted. Using those data for the period after the 2000 Presidential election one can get a picture of those who do not vote even for President. (Of course asking someone whether or not he or she voted is likely to elicit a certain amount of lying. Indeed, about 55 percent of those sampled claim they did vote, about seven percent more than those who actually did.)
- Women are more likely to vote than men (57 percent to 52 percent).
- Blacks are more likely to vote than whites (61 to 57 percent).
- Renters are slightly more likely to be voters than owners (57 to 54 percent).
- Those that own a business are more likely than those who do not (62 to 55 percent).
- Those working and those retired are more likely to vote than those without jobs (60 to 50 percent). However, there is no relationship between family income and voting.
Those in higher status occupations and those with college degrees voted at a higher proportion than others eligible (68 to 55 percent).
Those married with spouse present, as well as those widowed, divorced or separated voted at much higher rates than singles or those living without their spouse. Those born in the United States were slightly more likely to vote, while those from Puerto Rico were slightly less likely to vote.
Though some demographic and other groups do vote at a somewhat higher rate than others, it is nonetheless the case that for virtually every population category non-voting is rampant. This is all the more true in non-Presidential contests, even when a handful of votes would make a difference.
Andrew A. Beveridge has taught sociology at Queens College since 1981, done demographic analyses for the New York Times since 1993, and provides expert testimony on a range of cases, including housing discrimination. The opinions expressed are his alone.


