
(photo: Ed Reed/Mayor's Office)
President Trump’s nonstop record of false claims (12,000-plus labeled false or misleading as of an August count in the Washington Post) received a brief respite recently when he tweeted that poverty and unemployment rates for black and Hispanic residents of the United States had reached record lows, which PolitiFact and other media outlets acknowledged as accurate.
While it’s true poverty rates for black and Hispanic Americans are down, as you’d expect, Trump still failed to talk about the whole truth.
Here it is: the causes of these improvements have included nine-and-a-half straight years of economic expansion, demographic changes that have brought people of color to 50% or more of the entering-prime-age workforce, and record levels of educational attainment. (Of course, the president did not comment on the continued severe racial and ethnic disparities in American society faced by people and communities of color.)
A closer look at some United States and New York City economic, poverty, and educational attainment data over time helps put the president’s point in the context of the profound racial injustices and disparities that are part of our society.
Snapshot - Recent History of Poverty and Unemployment
The U.S. Census reported recently that the poverty rate for black Americans was 20.8% in 2018, while the poverty rate for Hispanics was 17.6%. Poverty rates for non-Hispanic whites and for Asian-Americans were far lower, and the overall poverty rate for Americans was 11.8%.
Monthly unemployment rates are more fickle than annual averages, but the Bureau of Labor Statistics August 2019 unemployment rates were 5.5% for blacks and 4.2% for Hispanics (yes, they were both record lows, although Hispanics had reached the same point earlier in the year). The unemployment rate was 3.7% overall.
Employment hit bottom in the Great Recession in February 2010 at about 130 million jobs after the U.S. lost 8.7 million jobs over a two-year period; in the next seven years under President Obama the economy gained 16 million jobs, and has gained 5.8 million jobs in two-and-a-half years under President Trump. The U.S. economy gained nearly 22 million jobs over nine-and-a-half years of uninterrupted economic expansion to reach the current unemployment numbers, including the record lows for black and Hispanic Americans.
Most Prime Workers are People of Color
The Washington Post presented the table below in a September article entitled, “For the 1st time, most new working-age hires in the US are people of color.“

In other words, one major reason black and Hispanic Americans are doing better is pure demographics -- they are half the new people getting jobs because they are half the people (along with other people of color) entering the labor force!
U.S. Recessions and Expansions Seriously Impact Poverty
The economic history of recessions and expansions, with increases and decreases in poverty rates, is not new. Below is a look at poverty in the United States from 1959 to 2010. In 1959, 55% of black Americans lived in poverty. The graph does not show it, but poverty for whites in 1959 was 18%.

Following a recession in the early 1990s, President Clinton oversaw an eight-year economic expansion that brought job gains of more than 22 million from 1993 to 2001, about the same as the current national expansion. The poverty rate in the United States in the year before Clinton became president was 14.5%, but much higher for blacks, 33.3%, and for Hispanics, 29.3%, according to U.S Census data.
By 2000, following those eight years of job expansion, the U.S. poverty rate had declined to 11.3%. The black poverty rate declined from 33.3% in 1992 to 22.1% in 2000, only slightly higher than the level just reached in 2018. The poverty rate for Hispanics in 2000 was 21.2%. It took an expansion with 22 million jobs gained to reach the record low black and Hispanic poverty rates under President Clinton, same as it took the 22 million job expansion from 2010 to mid-2019 to reach the recent record low.
A smaller recession occurred in the United States in 2001, followed by lower economic growth. By 2007, the year before the Great Recession, the poverty rate rose to 12.5% overall, and was 24.5% for black Americans and 21.5% for Hispanic Americans. Following the Great Recession of 2008-2009, and an initially limited recovery in 2010, the poverty rate in 2011 reached 15% overall, and the rates were 27.6% for blacks and 25.3% for Hispanics.
As the health of the American economy improved, poverty rates declined again. By the end of President Obama’s second term, in 2016, the overall rate was 12.7%, and poverty rates had declined for blacks to 22.0% and for Hispanics to 19.4%. It took gains of 16 million jobs from 2010 to the beginning of 2017 to bring these poverty reductions.
What About New York City’s Poverty Rate?
New York City’s poverty rate has hovered around 20% of its population for decades, according to a 2011 New York Times article based on census data.
In 1990, the poverty rate was 19.3 %, in 2000 it was 20.1%, it had dropped to 18% by 2007 before the Recession, and it swung back up to 21.2% by 2012. In 2017, the New York City poverty rate was 19.6%, according to the American Community Survey. In 2017, 22.3% of black New Yorkers and 27.3% of Hispanic New Yorkers were living in poverty.
People of Color, Despite Discrimination, Have Achieved Record Educational Attainment
It’s hardly a secret that the American economy has transformed itself into a service and information economy with higher demand for educated workers. People of color in the United States (and New York) have persevered in the challenge to gain skills, despite significant barriers. Black, Hispanic, and Asian populations have achieved record educational attainment, a success correlated with hard work in the face of discrimination that is a record in each and every year, very different than the up and down swings of the economy.
Why focus heavily on educational attainment? Because the correlation between educational attainment and poverty is very strong. Below are the U.S. Census Income and Poverty data on this correlation for 2017 for persons age 25+, with poverty rate by educational attainment levels.
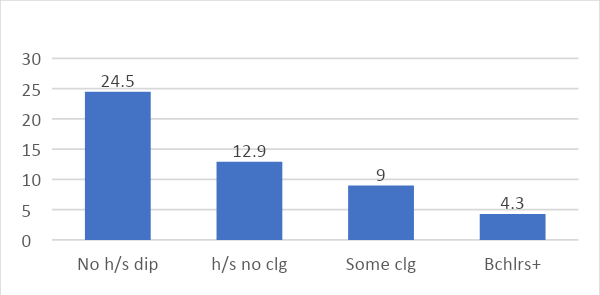
For persons 25+ without high school diplomas, nearly 25% lived in poverty in 2017. For persons 25+ with high school diplomas but no college, 12.9% lived in poverty. For those 25+ with some college, 9%, and for those 25+ with bachelor’s or higher, 4.3%. (In 2018, 16.2% of persons under the age of 18 lived in poverty.)
Across the United States, younger black people, ages 25-29, have achieved near parity with whites in the percentage who have completed high school, according to the Current Population Survey. Younger Hispanics are also achieving much improved high school completion rates, and young Asians have higher high school completion rates than whites.
COMPLETED 4 YRS HIGH SCHOOL OR MORE AGE 25-29

Although younger black and Hispanic Americans are closing the gap with whites in high school completions, for the full population over the age of 25 they still suffer from disadvantages compared to the rest of the nation in the attainment of bachelor’s degrees and higher.
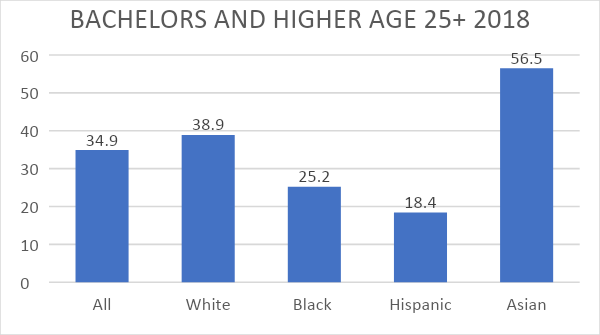
The following table on the history of educational attainment shows the long struggle to move forward for American communities of color, along with the extraordinary disadvantages they suffered compared with whites during U.S. history.*,**
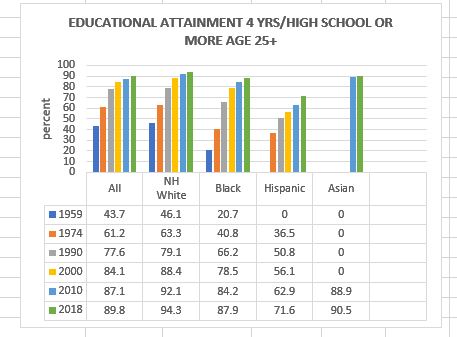
*The Census in 1990 and earlier reports whites, not non-Hispanic whites. The zeros reflect that the Census did not report these numbers in those years.
**1974 is the first year Hispanics are reported separately.
In NYC, High School Graduation Rates for Communities of Color Have Improved Dramatically
In New York City, high school graduation rates for black and Hispanic students have improved dramatically over time, like in the rest of the nation. The table below is from the New York City Department of Education for 2018 and provides the graduation rate for an entering 9th grade group, called a cohort, for August of their fourth year of high school. The cohort is the group of students who entered 9th grade in 2014.

What the table above does not show is how many students were still enrolled in school after that summer of their fourth year, but have not yet graduated. It’s important to include the number of students still enrolled because large numbers of students do complete high school after their fourth year.
The 2014 9th grade cohort of black students shows 72.1% graduated by August 2018, but DOE statistics also show that 18.6% of the black students in the 2014 cohort were still enrolled but had not graduated.
Looking at the six-year graduation rate for black students, for the 2012 9th grade cohort, 77.5% had graduated and 5.5% were still in school.
For Hispanic students, 70% of the 2014 9th grade cohort had graduated and 17.9% were still in school. For the 2012 cohort, 74% had graduated and 5.2% were still in school.
Similarly, graduation rates for the New York City school system over the past few decades show enormous improvements. Going back to 1992, only 51% of New York City high school students graduated overall, and those numbers excluded full-time special education students. In 2005 the state government required the city to include special education students in the graduation rates, so the overall rate restarted in 2005 at 46.5% and for general education students was 58.2%.

The chart above does not have racial/ethnic breakdowns, but the DOE does have published racial/ethnic data for the 9th grade cohort entering in 2001, including graduation rates for 2005, as well as their six-year graduation rates.
The table below shows the six-year graduation rates, with those still enrolled, for the New York City school system for all students, and black and Hispanic students for the 9th grade cohort that entered in 2001.
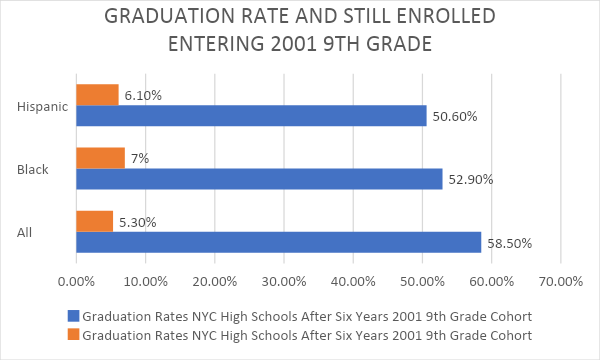
For the entering 9th grade cohort that year, about 53% of black students had graduated by their sixth year, and 7% were still in school. For the 2012 cohort, 77.5% of black students had graduated by their sixth year, and 5.5% were still enrolled. For the 2014 cohort, 72.1% of black students had graduated by summer of their fourth year, and 18.6% were still in school.
For the entering 9th grade cohort of 2001, of Hispanic students, 50.6% had graduated by their sixth year, about 6% were still enrolled. For the 2012 9th grade cohort, 74% had graduated and about 5% were still in school. For Hispanic students in the 2014 9th grade cohort, 70% had graduated and 17.9% were still in school.
The numbers for students who had graduated after six years or were still enrolled have improved dramatically between the 2001 entering cohort and the 2012 and 2014 entering cohorts.
Educational “Achievement Gap” for NYC Students is Narrowing
The New York City Department of Education also reports on the extent to which the “achievement gap” between black, Hispanic, and white students for high school completions is narrowing.

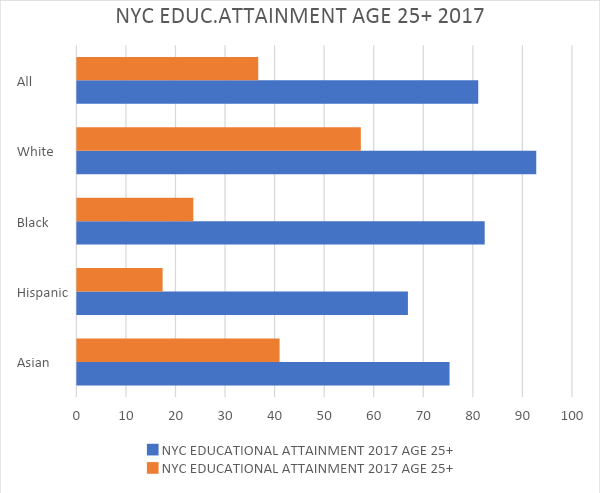
Educational attainment rates for New York City residents age 25 and over continue to show major disparities between whites and the city’s populations of color; 57% of whites have a bachelor’s degree or higher, compared to about 24% of blacks and 17% of Hispanics. About 93% of whites have completed high school or higher, versus 82% of blacks and 67% of Hispanics.
Across the nation, 39% of whites have college degrees or better, compared to 57% of whites in New York City. About 23.6% of blacks in New York City have college degrees, compared to about 25% nationally. In the city, 17.4% of Hispanics have college degrees or better, compared to 18.4% of Hispanics nationally.
So, while President Trump’s tweet about black and Hispanic populations reaching historically low levels of poverty and unemployment was true, this achievement has nothing to do with advances brought forward by his administration. It’s been a slow and overall steady – but sometimes rocky – climb, which includes almost a decade of straight economic expansion, demographic changes that have brought people of color to 50% or more of the entering prime age workforce, and record educational attainment for black and Hispanic Americans.
***
Jim Brennan was a member of the New York State Assembly for 32 years, where he chaired four committees. On Twitter @JimBrennanNY.
***
Have an op-ed idea or submission for Gotham Gazette? Email This email address is being protected from spambots. You need JavaScript enabled to view it.


